How to Predict Ad Fatigue Before Your ROAS Drops


- Ad fatigue prediction means estimating, from the slope of leading signals, the week an ad will cross your cost line.
- Frequency, the share of impressions reaching someone new, and early response lead. Cost per result and profit per ad are outcomes: they confirm a decline and never predict one.
- Read each signal as weekly points against the same ad's own first full week, never against an account average.
- The trigger equals the danger level plus the lead time multiplied by the weekly slope, so the ad trips it while it still earns a profit.
- An alert on ROAS or cost per result fires after the money is spent, and the tired ad keeps spending through the weeks a replacement takes.
- A slope points to decay, not to its cause. Check a sibling ad for audience saturation, an auction change, seasonality or a tracking break before you call it fatigue.
- Omniconvert Commander measures True Profit per ad, which sets the cost line, and you approve what goes live. The slope work runs in a spreadsheet.
To predict ad fatigue, read the slope of a few signals on each ad and act before the cost line is crossed. Most teams learn that an ad has faded from cost per result, which is the last number to move. By then no replacement exists, and the tired ad keeps spending while one is made.
Omniconvert Commander (formerly Nexus) is the AI eCommerce growth engine for Shopify brands: it reads your store, ad and customer data, ranks growth opportunities by profit impact, and builds the campaigns to act on them, and you approve what goes live. The method runs in a spreadsheet. The glossary entry on creative fatigue forecasting defines the practice, and what follows is the worked method behind it.
How to predict ad fatigue: slope, cost line and lead time
Ad fatigue prediction is defined as estimating, from the slope of leading signals, the week an ad will cross your cost line, early enough to put a replacement live before it does.
The cost line is the cost per result at which the ad's profit falls to break-even, a POAS, or profit on ad spend, of 1.0. Store economics vary across the 7,000+ websites in the CROBenchmark Report 2026 [CROBenchmark Report 2026, Omniconvert], so take the line from your own profit. The slope is how many points a signal moves per week. Lead time is defined as the number of weeks between the trigger firing and a replacement going live.
Most teams already own one alert: warn me when ROAS falls under target, or when cost per result passes a ceiling. It feels right, because that is the number the business cares about. The cost is the lag. The alert fires after the decline has already cost money, and only then does the brief start. Add the weeks to write, produce and approve a replacement, and the tired ad spends below break-even for the whole gap. It was often visible for weeks in signals nobody charted.
Three leading signals and two outcomes to track on each ad
| Signal | How to compute it each week | Direction as an ad wears out | What else moves it |
|---|---|---|---|
| Frequency (leading) | Impressions divided by reach since launch | Climbs first | A narrow audience, or a budget raised on the same audience |
| New-reach share (leading) | Reach since launch, minus last week's figure, divided by this week's impressions | Falls as fewer new people remain | Reach already taken by a sibling ad on the same audience |
| Early response (leading) | Click-through rate for a static ad; three-second views divided by impressions for a video | Falls, often before cost does | A shift in placement mix, or a seasonal dip in intent |
| Cost per result (outcome) | Spend divided by results in the same week | Rises last | Auction pressure or a tracking break |
| Profit per ad (outcome) | Store revenue minus returns, discounts and costs, divided by ad spend | Falls last, and sets the cost line | Discounting and product mix |
Do not sum daily reach: a person seen on Monday and Tuesday counts once. Pull reach for the whole period since launch and subtract last week's figure.
The guide on how often to refresh ad creative lists three signals that say refresh now: frequency, cost per result drifting against a flat auction, and a hook that stops holding. Those say a refresh is due. The signals here warn earlier, because you read them as slopes.
The last two rows are outcomes. They show whether the prediction was right and they set the cost line, but both warn late. ROAS also moves with discounts and returns. The measure behind the last row is True Profit in ecommerce.
How to read the slope over a window
Use one point per ad per week, from a seven-day window. Daily numbers swing with the weekday, so a daily slope raises false alarms. A low-spend ad may need a fourteen-day window.
Start at the first full week after launch, because the first days of delivery are noisy, and compare each ad with itself, not with an account average.
My working rule: three weekly points give a direction, because they hold two weekly changes. Four give a trend. Two changes in the same direction count as a move. It is a rule of thumb from what I have seen across brands, not a published threshold.
Decay rarely runs in a straight line. As an ad slips, delivery tends to give it fewer cheap impressions, which speeds the slide. Treat a straight-line projection as the latest date the ad can last, and add a spare week to your lead time.
Set a trigger that buys lead time
A fatigue trigger is defined as the value a leading signal reaches when it is time to start the replacement. For a signal that falls, such as early response, it has three inputs.
- Danger level. The value of the signal in the week a past ad crossed your cost line. Read it from three or more retired ads in your account. With fewer, use a judgment value and mark it as a guess.
- Lead time. The weeks from brief to live for your last three launches, plus a spare week.
- Weekly slope. The fall per week, from the section above, counted as a positive number.
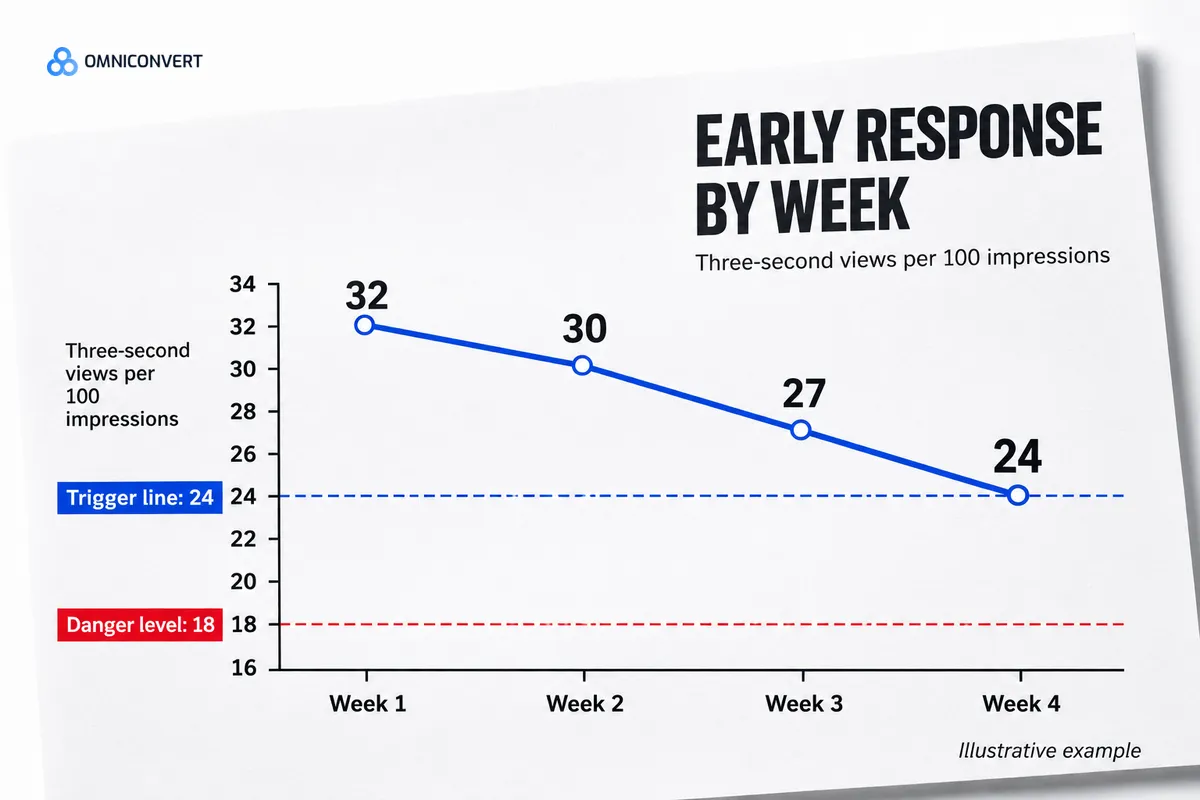
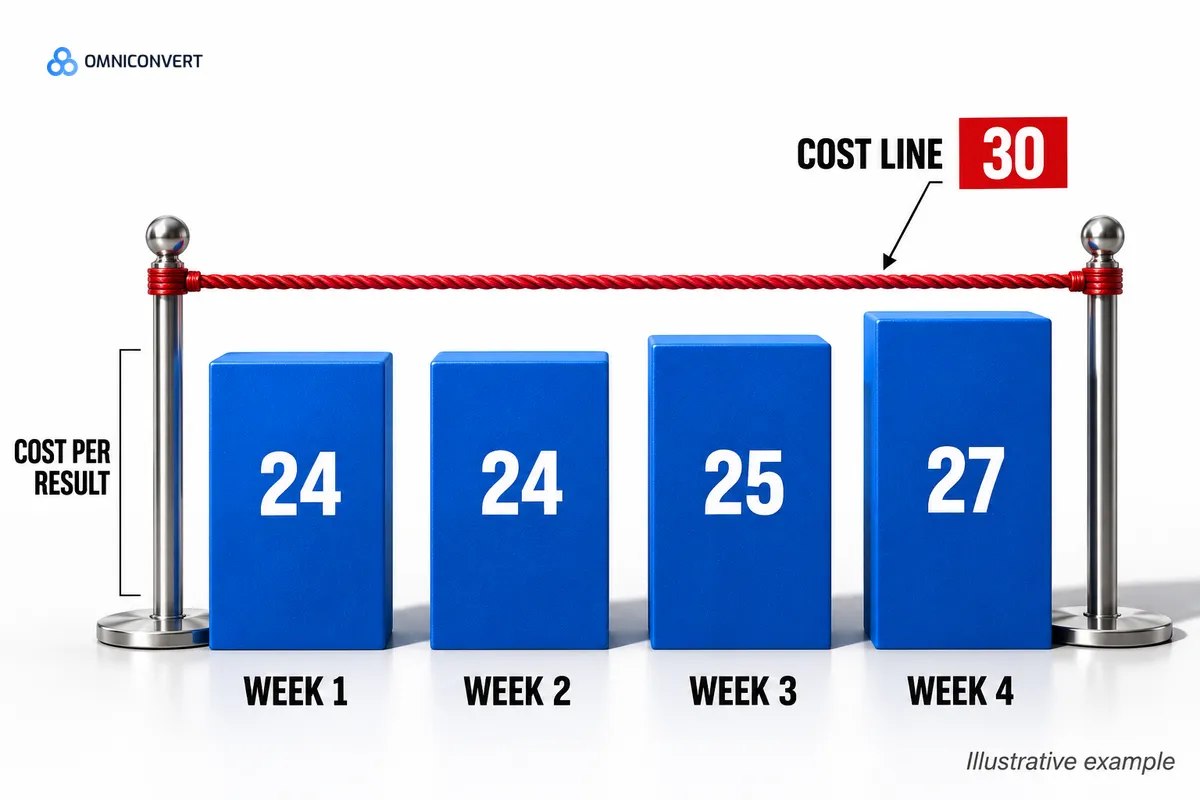
Here is an illustrative example, with invented numbers that are not data. An ad's early response, in three-second views per 100 impressions, reads 32, 30, 27 and 24 over its first four weeks. Its cost per result reads 24, 24, 25 and 27, against a cost line of 30. Past ads crossed the cost line when early response sat near 18, and a replacement takes two weeks to go live, spare week included.
The slope over the last three points is (24 - 30) / 2, which is a fall of 3 per week. The trigger is 18 + 2 x 3 = 24. Week 4 reads 24, so the trigger fires. At that slope the ad reaches 18 in two more weeks, so a replacement briefed today lands on time. Cost per result sits at 27, under the line, so an alert on it would stay quiet.
Treat the trigger as a hypothesis. Run it on the next ad that fades, compare the week it fired with the week the cost line was crossed, and move the danger level.
Once a replacement is live, read it against the old ad like any test, with the result line written first.
AliveCor used Omniconvert to run a structured A/B testing programme and achieved +21% conversion rate, +5% revenue per visitor, and 94% statistical relevance across their experiments. [Omniconvert, AliveCor case study]
Predict ad fatigue in six steps
- Log three leading signals and two outcomes per ad each week. Record frequency since launch, new-reach share and early response, then cost per result and profit per ad, one row per ad per week, starting with the first full week after launch.
- Set the cost line from profit. Work out the cost per result at which the ad's profit falls to break-even, a POAS of 1.0. That is the line the ad must not cross.
- Read the slope on the last three or four points. For each leading signal, subtract the oldest point from the newest and divide by the weeks between them. Two weekly changes in the same direction count as a move.
- Find the danger level in your own history. Look up each signal's value in the week a past ad crossed the cost line. With fewer than three past ads, use a judgment value and mark it as a guess.
- Measure your lead time. Count the weeks from brief to live for your last three launches, then add a spare week.
- Set the trigger and let it start the brief. Trigger equals danger level plus lead time multiplied by the weekly slope. When a leading signal crosses it, check a sibling ad for look-alikes, then brief the replacement.
The method stops at the brief. For an ad that has already faded, see the ad creative fatigue solution.
Omniconvert Commander reconciles against Meta and Google Ads daily and measures True Profit per ad, which feeds the cost line in step 2. It does not draw a fatigue curve, so the slope stays in your spreadsheet. For the replacement itself, it generates launch-ready assets from customer data, and you approve what goes live.
What a prediction cannot tell you
Check a sibling first: an ad on the same audience that launched in the last two weeks. If its signals slide the same way, the cause probably sits outside the creative. The creative fatigue guide sets out the four look-alikes, audience saturation, an auction change, seasonality and a tracking break, with a check for each. Until a check confirms the cause, a falling signal is decay, not yet fatigue.
A new ad has no slope. With fewer than three weekly points you have a level and nothing else, so read days active first.
The date can move: a sale or a new offer can bend the slope, so re-read the points each week. Whether the angle or only the execution is spent is a call for the fix.
FAQ: predicting ad fatigue
What does it mean to predict ad fatigue?
To predict ad fatigue is to estimate, from the slope of leading signals such as frequency and early response, the week an ad will cross your cost line. The aim is lead time: a brief that starts while the ad still earns a profit, not after cost per result has already risen.
What is lead time in ad fatigue prediction?
Lead time is the number of weeks between the trigger firing and a replacement going live. Measure it from your last three launches, from brief to live, and add a spare week.
How early can you predict when ads stop working?
As early as the third weekly point, because three points give a direction. The lead you get depends on how steeply the signals move and how long your replacement takes.
Is cost per result a good signal for predicting ad fatigue?
No. Cost per result is the last signal to move, so it confirms a decline that frequency, new-reach share and early response showed weeks earlier. Use it to check that your trigger fired in time, and use profit per ad to set the cost line it is measured against.
How does Omniconvert Commander help me predict and replace fading ads?
Omniconvert Commander does not draw a fatigue curve, so the slope work runs in a spreadsheet. It measures True Profit per ad, which sets your cost line, and recommends scale, hold, reduce or kill on each ad. It also generates launch-ready assets from customer data for the replacement. You approve what goes live.
Watch the slope
A cost per result that still looks fine says little about an ad that is already wearing out. Track three leading signals and two outcomes, read them as weekly points, and set a trigger from your own danger level and lead time. The replacement is then briefed while the old ad still pays for itself.