How Long to Run an A/B Test: The Rules for Test Duration

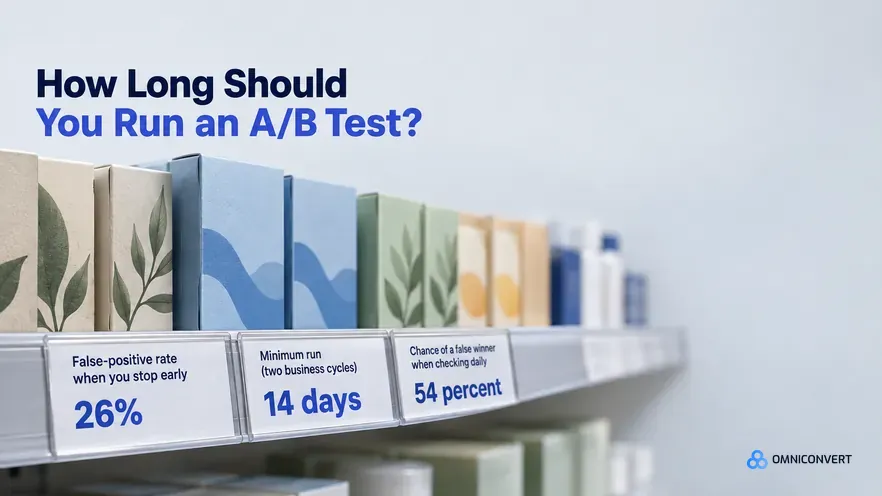
- Test duration is calculated before launch, not decided during the test: required sample size per variation divided by daily eligible traffic, floored at two full business cycles.
- Two full weeks (14 days), ending on the same weekday you started, is the non-negotiable minimum so weekday and weekend behavior are equally represented.
- Stopping at the first significant-looking moment inflates the false-positive rate from 5 percent to about 26 percent; checking daily for two weeks gives roughly a 54 percent chance of a false winner even when variants are identical.
- Low traffic, a low baseline conversion rate, and a small minimum detectable effect all lengthen a test; most valid ecommerce tests run four to six weeks.
- You may only stop early if you commit to a sequential or Bayesian method before launch, never as an excuse to peek at a fixed-horizon test.
A/B test duration is the length of time an experiment runs before you read its result, and the honest answer to how long that should be is not a single number: it is at least two full business cycles, about 14 days, and until the test reaches the sample size you calculated before launch, whichever comes later. Most valid ecommerce tests land between four and six weeks. Across the CROBenchmark dataset of 7,000+ websites in 15+ industries, measured against 248+ audit criteria, the recurring failure was not tests that ran too long but tests stopped too early on results that never held [CROBenchmark Report 2026, Omniconvert].
That single fact reframes the whole question. "How long?" is really "what stops me from stopping too soon?" This guide answers duration as a discipline problem, not a math problem: how to set the endpoint before you launch, why two cycles are the floor, how to calculate the days you need, and why calling a winner the moment a result looks significant is the most expensive habit in testing. It is the companion to the sample-size question: sample size tells you how much data, duration tells you how much time, and they are the same commitment made in advance.
How long should you run an A/B test?
Ask ten CRO practitioners how long to run a test and you will get "it depends," followed by a lecture on statistics. Both are true and both are useless when you have a test running right now and a stakeholder asking whether they can ship. So here is the usable version: two weeks minimum, until your sample size lands, four to six weeks for a typical store.
The trouble is that the number is not really the problem. Teams rarely fail because they picked 12 days instead of 14. They fail because they picked a sound duration, watched the test, saw a variant jump ahead on day three, and shipped it. The duration was fine; the discipline was not. That is why the rest of this article treats "how long" as a question about commitment, not arithmetic.
How do you decide A/B test length before launch?
The most useful mental model here is the Ulysses pact: a commitment you make in advance to bind your future self against a temptation you know is coming. Ulysses had his crew tie him to the mast so he could hear the sirens without steering the ship onto the rocks. Setting your sample size and minimum duration before launch is the same move. You know that on day three a variant will look like a winner, and you know the version of you watching that dashboard will want to ship it. So you tie yourself to the mast now, while you are calm and the numbers are abstract.
This works because of a bias Daniel Kahneman named the law of small numbers: people place far too much faith in patterns drawn from tiny samples. A three-day lead feels like signal because our intuition treats a small sample as representative of the whole. It is not. Pair that with regression to the mean and the day-three winner is not just untrustworthy, it is predictable: extreme early results drift back toward reality as the sample grows, which is precisely why the exciting lead so often evaporates by week two.
In our CRO audits across ecommerce brands through 2026, we repeatedly find that the tests teams describe as "obvious winners" after a few days rarely survive contact with the full sample [Omniconvert, 2026]. The fix is never a better gut. It is a rule set before the gut has anything to react to.
Why are two full business cycles the minimum test duration?
Test duration is defined as the elapsed time an experiment collects data before its result is read, and its floor is set by the business cycle rather than by the calendar. In ecommerce, the cycle is a week: traffic, intent, and conversion rate move in a predictable weekly pattern, and a test that does not cover whole weeks reads a biased sample. If you start on a Tuesday and stop the following Sunday, you have counted two weekends and one set of weekdays, and the imbalance alone can manufacture a "result."
Why two cycles instead of one? Because a single week can itself be the anomaly. A payday spike, a flash promotion, a competitor outage, or one viral post can make an ordinary variant look extraordinary for seven days. A second cycle asks a simple question of the first: does the pattern repeat, or did you catch one unusual week? Only a pattern that holds across two cycles has earned the word "result." This is Twyman's Law in practice: any figure that looks unusually interesting is usually wrong, so the surprising early number deserves more scrutiny, not less.
End on the same weekday you started. Fourteen days from a Tuesday is a Tuesday, and that symmetry is what keeps weekday and weekend visitors equally weighted. The 14-day floor is not the target; it is the earliest a fixed-horizon test may end, and only if the sample size has also been met. For a fuller definition of the term, see the test duration glossary entry.
How do you calculate A/B test duration?
The formula is short: duration in days = required sample size per variation ÷ daily eligible visitors per variation, floored at two business cycles. "Eligible" matters, count only the visitors who actually enter the test, not total site traffic. Then you take whichever is longer, the calculated days or 14, so a very-high-traffic page still runs the cycle floor.
The sample size itself comes from four inputs, which you set in a sample-size calculator before launch:
- Baseline conversion rate: where the control sits today. Lower baselines need more traffic to detect the same relative change.
- Minimum detectable effect (MDE): the smallest lift worth catching. A smaller MDE means a larger sample and a longer test.
- Statistical confidence: conventionally 95 percent, meaning a 5 percent tolerance for a false positive.
- Statistical power: conventionally 80 percent, the chance of detecting a real effect that exists.
Statistical power is defined as the probability that a test detects a true difference between variants when one genuinely exists. It matters in ecommerce because an underpowered test does not just risk a wrong answer; it risks a confidently wrong "no difference" that talks you out of a change that actually worked. The table below shows how the same page produces very different durations as traffic and baseline move.
| Daily eligible visitors / variation | Baseline conversion rate | Approx. sample needed / variation | Practical duration |
|---|---|---|---|
| 2,000 | 5% | ~30,000 | 2 to 3 weeks |
| 750 | 3% | ~52,000 | ~10 weeks |
| 500 | 2% | ~80,000 | Longer than feasible; test a bigger change |
| 5,000 | 8% | ~18,000 | 2 weeks (cycle floor governs) |
The bottom row is the point most teams miss: even when the math says four days, the two-cycle floor keeps the test at 14. And the third row is the honest one, some pages simply cannot be tested reliably at their current traffic, and knowing that before launch saves you from a six-week test you will be tempted to cut short anyway.
What is the peeking problem in A/B testing?
Peeking is defined as repeatedly checking an experiment's results and ending it as soon as it looks statistically significant, rather than at a pre-committed endpoint. It matters because significance testing assumes a single look at a fixed sample; every extra peek quietly breaks that assumption and multiplies your chance of a false positive.
The numbers are stark. As Evan Miller's widely cited analysis shows, a test where you stop at the first sight of p < 0.05 does not carry a 5 percent false-positive rate, it carries about 26 percent. Peek ten times over a run and what your tool reports as 1 percent significance is really closer to 5 percent. A test you check daily for 14 days has roughly a 54 percent chance of showing at least one false "winner" even when the two variants are genuinely identical. You are not measuring your variant; you are measuring your own impatience.
This is why "we hit 95 percent, let's ship" is not a stopping rule, it is the trap itself. Significance is a checkpoint you are allowed to read only once your pre-committed sample size and cycle floor are met. Reaching 95 percent on day four means nothing if your plan called for 30,000 visitors and you have 6,000. The threshold has not been earned; it has been stumbled into.
Nexus by Omniconvert sizes each experiment before launch and holds it open until the sample and the cycle floor are met, so you cannot ship a day-three fluke by accident.
See how it works →The ecommerce brands that plateau at a 2 to 3 percent conversion rate consistently share one pattern: they run a high volume of tests but stop them at the first flattering result, so their "wins" are a mix of real lifts and false positives that quietly cancel out in revenue. The benchmark gap closes fastest when a team treats the pre-committed endpoint as the primary unit of testing discipline, not the count of tests shipped or the size of the leads on the dashboard.
What makes A/B tests run longer than expected?
If your calculated duration keeps coming back longer than you would like, the cause is almost always one of these:
- Low traffic: fewer eligible visitors per day stretches the same sample size across more calendar time. This is the most common constraint for small and mid-sized stores.
- Low baseline conversion rate: the lower the starting rate, the more visitors it takes to detect a change with confidence, which is why a 2 percent page tests far more slowly than an 8 percent one.
- Small minimum detectable effect: chasing a 2 percent relative lift needs vastly more data than catching a 15 percent one. Bolder changes are faster to validate.
- Segmented analysis: splitting results by device, source, or new-versus-returning shrinks each cell, so each segment needs its own sample to be trustworthy.
- Seasonality and volatility: promotions, holidays, and paid-traffic swings add noise that a longer, whole-cycle run absorbs but a short one amplifies.
The mistake is to treat these as reasons to shorten the test. They are reasons to change what you test: pick higher-traffic pages, design bigger swings, or test further up the funnel where volume is greater. A valid short test beats an invalid one every time, a lesson visible across these A/B testing examples and in how successful ecommerce teams run tests that convert.
AliveCor used Omniconvert to run a structured A/B testing programme and achieved a +21% conversion rate, +5% revenue per visitor, and 94% statistical relevance across their experiments [Omniconvert, AliveCor case study]. The relevance figure is the tell: results were held to a real significance bar and full runs, not called early, which is what made the conversion lift durable rather than a number that looked good on a Tuesday.
When can you stop an A/B test early?
There is a legitimate way to stop early, and it is not "the result looks strong." Two families of methods are designed for continuous monitoring:
- Sequential testing (e.g. SPRT): adjusts the significance boundary for the fact that you are looking repeatedly, so you can stop as soon as the evidence is genuinely conclusive without inflating false positives.
- Bayesian testing: reports the probability that a variant is better given the data so far, which is designed to be read continuously rather than at a single fixed endpoint.
The catch is non-negotiable: you adopt these before launch, as your testing protocol, not after you have already been peeking at a fixed-horizon test. Using a Bayesian dashboard as an excuse to stop a classical test early gives you the worst of both, the license to peek without the math that makes peeking safe. Choose your method up front, then follow it. Even with a sequential method, the two-cycle floor still applies, because no amount of statistical cleverness fixes a sample that has only seen weekdays.
What is the A/B test duration checklist?
Run this before every test. If you cannot tick all five, you are not ready to launch:
-
Calculate the sample sizeFeed your baseline conversion rate, target MDE, 95 percent confidence, and 80 percent power into a calculator. Write the required sample per variation down.
-
Convert to daysDivide the sample by daily eligible visitors per variation to get the calendar time you need at your real traffic.
-
Apply the cycle floorTake whichever is longer, your calculated days or 14, and set the end date on the same weekday you started.
-
Write the endpoint downRecord the fixed end date and sample target where the team can see it. An endpoint that lives only in your head is one you will renegotiate under pressure.
-
Pre-commit to your stopping ruleFixed-horizon by default; sequential or Bayesian only if chosen now. Agree out loud that a strong day-three lead is not a reason to stop.
For the deeper mechanics of the number this checklist protects, the companion guide on statistical significance and when to call a winner covers what "95 percent" actually means, and the A/B testing best practices guide covers the surrounding process.
A/B test duration FAQs
The minimum is two full weeks, spanning two complete business cycles, and ending on the same weekday you started, even if the test looks significant sooner. A cycle floor keeps weekday and weekend behavior equally represented. Anything under 14 days risks reading a day-of-week or single-event fluke as a real result, so 14 days is a floor rather than a target.
No. Significance alone is not a stopping condition. If you watch a test and stop at the first moment it crosses 95 percent, you inflate the false-positive rate from 5 percent to about 26 percent, because repeated looks give random noise many chances to cross the line. You need your pre-calculated sample size and the two-cycle floor, both fixed before launch, before significance means anything.
Divide the required sample size per variation by your daily eligible traffic to get the number of days, then take whichever is longer, that figure or 14 days. Get the sample size from a calculator using your baseline conversion rate, the minimum detectable effect you care about, 95 percent confidence, and 80 percent power. Lower baselines and smaller effects both require more data and a longer test.
One cycle can itself be an anomaly: a promotion, a payday week, a slow stretch, or a traffic spike from a single campaign. A second cycle confirms the pattern repeats rather than that you happened to capture one unusual week. Two cycles also cover both weekday and weekend visitors, whose intent and conversion rates often differ enough to swing an under-sampled result.
Expect a longer test, or change what you test. Test bigger, bolder changes, because a larger minimum detectable effect needs less data. Test higher-traffic pages or steps closer to the top of the funnel. Before launching, use a sample-size calculator to check whether a valid test is even feasible in a reasonable window; if it needs six months, the honest answer is that the page cannot be tested reliably yet.
Nexus by Omniconvert sizes an experiment before it launches, using your baseline conversion rate and eligible traffic to set the required sample size and the minimum duration, then holds the test open until both are met. Instead of a dashboard that tempts you to stop at the first green result, teams get a fixed endpoint and a ranked queue of which tests to run next, so duration becomes a rule the tool enforces rather than a judgment call made under pressure.
Duration only feels like a hard question because it is usually asked at the wrong moment, on day three, when a lead looks exciting and the pressure to ship is highest. Move the decision earlier and it stops being a judgment call: calculate the sample size and the two-cycle floor before you launch, write the endpoint down, and treat it as fixed. The teams that win consistently are not the ones with better instincts about when a test is done; they are the ones who removed instinct from the decision. Set the endpoint before you can be tempted, then obey it.
Set the endpoint before you launch, then let the test finish
Nexus by Omniconvert sizes every experiment up front, from your baseline conversion rate and eligible traffic, sets the minimum duration, and holds the test open until both the sample size and the cycle floor are met. No more shipping a day-three fluke as a winner.