The Creative-to-Profit Gap: Why No Tool Connects Ads to Profit

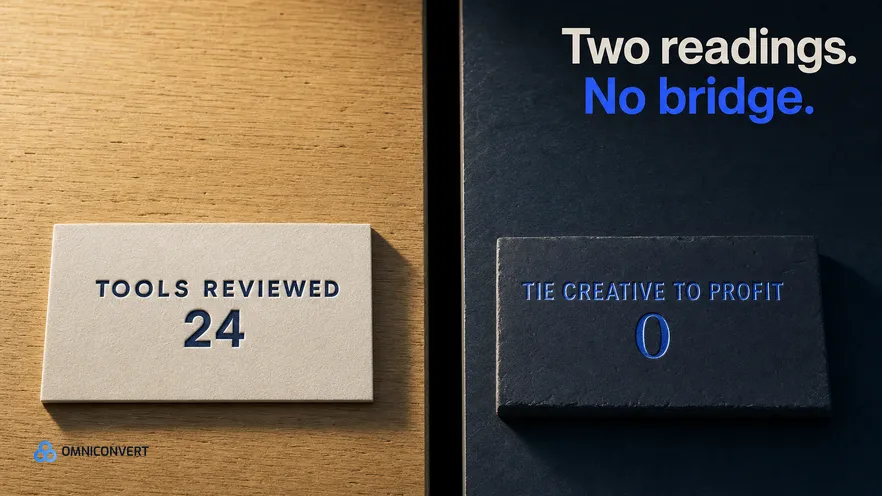
- Structural creative signals say what is competitive. Profit and margin say what is earning. They are separate readings on separate data.
- Of roughly 24 tools reviewed, none tied ad creative to profit or margin, and only one touched retention at all.
- A long-running ad proves durability, never profitability, and the leap between the two is the most common overreach in creative analysis.
- The gap persists because the two datasets sit in different systems, owned by different teams, on different reporting clocks.
- Run both readings and keep them separately labelled. A blended creative-and-profit score is less useful than either half.
Creative intelligence tells you what is structurally competitive. Profit clarity tells you what is actually earning. They are two different readings, built from two different datasets, and almost nothing in the category connects them. That gap is why a team can run a creative audit, act on every finding, and still not know whether better advertising made the business any money. Last updated: September 2026.
Omniconvert has measured how storefronts acquire and convert customers across the CROBenchmark dataset of 7,000+ websites in 15+ industries, against 248+ audit criteria, over 13 years in eCommerce, and reads live advertising through the eCommerceBenchmark ad library. This is the one piece in this series that crosses between the two lanes, so it is written as a framework rather than as a blend. The structural signals stay structural. The financial ones stay financial. The whole point is that the join does not currently exist.
What are the two lanes: creative intelligence and profit clarity?
Naming the lanes matters because most confusion in this area comes from a single word doing two jobs. "Performance" means competitiveness to a creative team and margin to a finance team, and both are using it correctly.
The structural lane is the eCommerceBenchmark side of this series. It reads what advertising does in market: which ads survive, how concentrated the results are, what formats a team can produce, and how a library compares against a named competitor set. Every one of those readings is available without a single financial figure, which is exactly why it works on competitors.
The financial lane is Nexus by Omniconvert: profit, margin, lifetime value and return on spend, computed from commerce data that only you have. It answers whether the customers your advertising produced were worth producing, which no public library can ever say.
Both readings are honest and neither is a substitute. The error is not preferring one, it is quietly letting one answer for the other.
What does creative intelligence tell you?
The structural readings are genuinely powerful within their range, and it is a wider range than teams expect.
Longevity tells you which creative has passed a repeated funding decision, and the argument for treating survival as evidence is in creative longevity and days active. Concentration tells you whether an account is compounding on a small number of durable winners or restarting its search every month, which is the reading behind the King Ad framework. Mix tells you what a team can produce, and coverage tells you where a library is absent.
What unites them is that they are all statements about competitiveness. They describe an advertiser's position relative to its category and relative to its own history. That is a real and actionable thing to know, and it is not a claim about money.
The limit is hard and worth stating plainly. A structural reading can tell you an ad is durable, distinctive and well produced, and it cannot tell you the orders behind it cleared their cost of goods.
What does profit clarity tell you?
This lane runs on data no ad library holds, and its defining property is latency.
A first-order return is visible within days. Whether that order survived a return, whether the discount that produced it left any margin, and whether the customer came back are visible over weeks and months. Which means the number that decides whether advertising worked arrives long after the decisions about that advertising were made.
That latency is the reason volume and first-order measures dominate media decisions even in companies that know better. It is not ignorance, it is a reporting clock problem, and the same dynamic shows up across growth allocation more generally.
Nexus by Omniconvert is where the financial lane lives in this series. Nexus by Omniconvert is the AI eCommerce growth engine: it unifies customer data, segments buyers by behavior and value, predicts churn, and ranks the next-best action, so profit, margin and lifetime value are read per segment rather than as one blended average. Everything in this section belongs to that lane, and nothing in it belongs to the structural readings above.
Why is there a gap of roughly 24 tools with no bridge?
The table below is the shape of that review.
| Capability | Tools covering it | Question it answers |
|---|---|---|
| Structural creative analysis | A substantial group | Is this advertising competitive? |
| Commerce and profit analytics | A substantial group | What is this business earning? |
| Retention, in any form | One (RetentionX) | Do these customers come back? |
| Creative tied to profit or margin | None | Did this advertising earn anything? |
The last row is the finding. It is not that the tools are weak, because many are excellent inside their scope. It is that the category has organised itself around two questions and left the join between them unowned.
The retention row deserves its own note, because retention is the natural bridge. A customer's value emerges over repeat purchases, so any system that connects acquisition creative to realised value has to hold retention data. That only one tool in the review touched retention at all explains a good deal about why the bridge does not exist.
Why does the creative-to-profit gap persist?
Three forces hold the gap open, and only one of them is technical.
The data has different shapes. An ad library is a public record of creative with dates attached. A profit calculation is a private derivation from orders, costs, returns and fees. Joining them requires carrying a customer identity from the ad that acquired them through to what they eventually spent and cost, and identity resolution across that boundary is genuinely difficult.
The clocks disagree. Creative decisions are made weekly. Profit resolves over months. A system that joined them would routinely tell a media team that a decision made in March was wrong, in June, which is useful and unpopular.
And the ownership is split. Creative sits with brand or agency, profit with finance or operations, and neither is measured on the other's number. The join has no natural owner, so it does not get built, and it does not get bought either, because no single budget holder feels the absence sharply enough to fund it.
What would a connected system do?
Describing the missing thing precisely is more useful than lamenting it.
At minimum, a connected reading would attribute each acquired customer to the creative and the angle that brought them, hold a margin-aware record of what that customer bought and cost, and report cohort value by angle after the repeat window rather than after the first order. Angles would then be ranked by the profit of the customers they produce, and that ranking would frequently disagree with the one produced by first-order return.
The disagreement is the point. Discount-led creative wins nearly every first-order measure and often loses on realised cohort value, because the customers it acquires are the ones trained to wait for the next discount. A structural audit cannot see that. A profit report can see it and cannot attribute it to an angle. Only the join reveals it.
Until that join is routine, the structural lane and the financial lane both stay valid and stay separate, which is a workable position as long as nobody quietly merges them in a slide.
How do you work across the gap today?
Four practices make the gap manageable rather than dangerous.
- Use structural signals for production decisions. What to brief, which formats to build, which angles to test, what to retire. These are competitiveness questions and the structural lane answers them well.
- Use profit for scale decisions. What to put more money behind and what to stop. That is a margin question and no amount of creative analysis substitutes for it.
- Never let durability stand in for margin. A competitor's ad running four months proves they keep funding it. It proves nothing about what it earns them, and the leap is the most common overreach in the field.
- Refuse the blended score. Averaging a structural reading and a financial one produces a number nobody can act on, and it hides the disagreement between the two, which is the most informative thing either of them had to offer.
The fourth is the one worth defending hardest. When the structural reading and the profit reading disagree, that disagreement is a finding: usually it means creative that competes well is acquiring customers who are not worth much, which is precisely the situation the two lanes exist to expose. A blended score deletes it.
FAQ: the creative-to-profit gap
Does better creative actually make more money?
Sometimes, and the honest position is that structural creative measurement cannot tell you when. Creative signals say whether your advertising is competitive in its category. Profit and margin say whether the customers it brought were worth acquiring. Both readings are real, they run on different data, and treating one as evidence for the other is where creative analysis usually overreaches.
What is creative intelligence?
Creative intelligence is the structural reading of advertising: how long ads stay live, how concentrated the library is, what the format mix looks like, and how angles and hooks compare against a category. It is built from public creative and needs no financial data, which is what makes it available on competitors as well as on yourself.
What is profit clarity?
Profit clarity is knowing what each order, product and customer actually earns after cost of goods, discounts, shipping, returns and fees. It lives in commerce data rather than in an ad library, it arrives slowly, and it answers the question creative measurement cannot: whether the customers acquired were worth acquiring.
How many tools connect creative to profit?
In a review of roughly 24 tools in the category, none tied ad creative to profit or margin. Most sat firmly on one side of the line, doing creative analysis or commerce analytics well and treating the other as out of scope. Only one, RetentionX, touched retention at all as scoped at the time of the review.
Why does the gap persist?
Because the two datasets sit in different systems, owned by different teams, reporting on different clocks. Creative data is public, immediate and structural. Profit data is private, delayed by returns and repeat purchase, and derived from operational records. Joining them is an integration problem and an organisational one, and the second is harder.
Does a long-running ad prove profitability?
No. It proves the advertiser keeps choosing to fund it, which is evidence about competitiveness rather than about margin. An advertiser optimising on return on ad spend can keep an ad live for months while the orders behind it lose money after cost of goods, discounting and returns, and the ad library shows none of that.
What should we do while the gap exists?
Run both readings and keep them separately labelled. Use structural signals to decide what to brief, produce and test, and use profit data to decide what to scale and what to stop. Resist the blended score, because averaging a structural reading and a financial one produces a number that answers neither question.
What would a connected system actually do?
It would carry a customer's realised value back to the creative that acquired them, so an angle could be judged on the profit of the cohort it produced rather than on first-order return. That requires identity resolution, a margin-aware order record and patience through the repeat window, and the value of it is the reason the gap is worth naming.
The bottom line
Two questions, two datasets, and a join that almost nobody has built. Structural creative measurement will tell you, honestly and without anybody's permission, whether your advertising competes in its category. Profit will tell you, slowly and privately, whether the customers it brought were worth having. Roughly 24 tools reviewed, and not one carries a customer's realised value back to the angle that acquired them. Until that changes, the useful discipline is unglamorous: run both readings, label them clearly, let the structural one decide what you make and the financial one decide what you scale, and treat the moments when they disagree as the most valuable output either of them produces. The blend is the only genuinely wrong answer, because it converts two clear readings into one that cannot be acted on.