Competitive Ad Benchmarking: How to Do It Without Spend Data

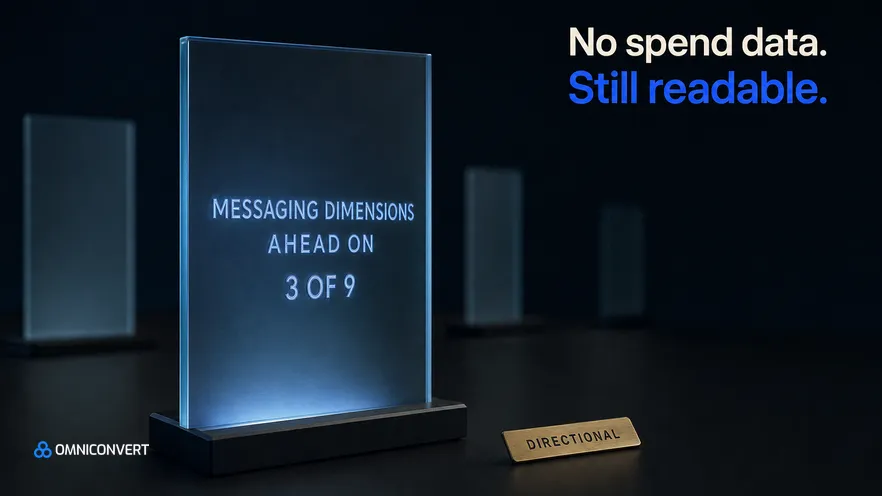
- Hooks, concepts, angles, formats and messaging coverage are all readable from a public ad library with no spend data.
- The audit scores one store at a time against a category baseline, rather than staging two brands against each other.
- In one audit a brand led on 3 of 9 messaging dimensions, and the finding was flagged directional because the sample was thin.
- Structural benchmarking says what a competitor argues and how durably. It never says what it earned them.
- Report the sample size and the competitor list with every number, or the reading becomes more confident than the evidence.
You cannot see a competitor's spend, return or conversion rate, and you never will. What you can see is everything they are currently arguing: the hooks they open on, the concepts they repeat, the angles underneath those concepts, the formats they can produce, and how long each ad has survived. That is a structural benchmark, it is built entirely from a public ad library, and it answers a different question from the one most teams start with. Last updated: September 2026.
Omniconvert has measured how storefronts acquire and convert customers across the CROBenchmark dataset of 7,000+ websites in 15+ industries, against 248+ audit criteria, over 13 years in eCommerce, and reads live advertising through the eCommerceBenchmark ad library. Competitive work fails more often from overclaiming than from missing data, so this piece is as much about what the method cannot support as about what it can.
It uses the classification set out in hook versus concept versus angle, because those three layers are what a structural benchmark is actually built out of.
What can you read about competitor ads without spend data?
The available surface is larger than most teams assume, because they start by asking for the numbers they cannot have and stop when the answer is no.
Every live ad carries its argument on its face. You can read what it claims, how it dramatizes the claim, and how it opens. Applied across a competitor's library, that produces a description of their strategy that is more reliable than anything they would tell you, because it is what they are paying to say rather than what they say about themselves. For a hands-on walkthrough, see how to analyze competitor ads on Facebook.
The first-seen date adds the second axis. Days active tells you which of their arguments has survived, which is the closest thing to a performance signal available from outside, and the reasoning behind treating it that way is in creative longevity. A competitor's angle that has been live for months is one they keep choosing to fund.
What stays invisible in competitive ad benchmarking?
Being explicit about the blind spots is what keeps the method credible, so here they are.
You cannot infer spend from ad count. A large library can mean heavy investment or an agency producing volume on a small budget, and the two look identical. You cannot infer results from prominence, because what you see is a sample of what is live rather than a weighted view of where money is going.
Most importantly, you cannot infer profit from durability. A competitor's ad running for four months tells you they keep paying for it. It does not tell you the customers it brought were worth having, and the temptation to make that leap is strong precisely because the structural evidence looks so solid. Where the two lanes meet, and why almost nothing connects them, is the subject of the creative-to-profit gap.
How do you measure messaging coverage in competitor ads?
Angle classification tells you what a single ad argues. Coverage tells you what the library argues in total, which is a different and often more useful reading.
The dimensions themselves are properties of a category rather than a universal list, and the examples above are illustrations of the kind of territory a category contains rather than a fixed taxonomy. What matters is that the set is defined once, written down, and applied identically to every advertiser in the analysis, including your own.
Coverage exposes a specific failure that per-ad review never finds. A library can be strong everywhere it speaks and completely silent on a territory the category treats as central. Every individual ad reviews well, and the gap only appears when you lay the whole library against the full set of dimensions and find one column empty.
Coverage and saturation are the two halves of the same competitive reading, and they answer opposite questions: coverage asks where you are absent, saturation asks where you are indistinguishable. The second is set out in saturation versus edge.
What did one competitive ad audit find?
The shape of that result is below.
| Reading | Dimensions | What it implies |
|---|---|---|
| Led the category baseline | 3 of 9 | Territories where coverage is genuinely stronger |
| Matched or trailed | 6 of 9 | Territories that qualify rather than differentiate |
| Confidence | Directional | Thin sample. A few ads either way moves the count |
Three of nine is worth reading carefully in both directions. It is a real position, and it is also six dimensions on which the brand is doing what its category does, which is exactly the pattern that produces a library everybody agrees is fine and nobody can distinguish.
The confidence row belongs in the table rather than in a footnote. A number that travels without its caveat gets quoted without it, and a directional finding presented as a firm one will be defended in a meeting six months later by somebody who never saw the sample.
Why should you audit one store at a time?
This is a methodological choice with a practical reason behind it.
A baseline built from a named competitor set is a reasonably stable object: it averages across several advertisers, so one brand's unusual quarter does not distort it. A direct pairing of two brands has no such stability, because both sides move and any difference could come from either one, or from the sample you happened to pull on the day.
There is also an interpretive problem. A pairing invites the conclusion that one brand is beating the other, which is a performance claim, and performance is precisely what this method cannot see. Scoring against a baseline keeps the finding in the register the evidence supports: this is where a single advertiser's coverage is strong, thin or absent relative to its category.
Nexus by Omniconvert is the AI eCommerce growth engine: it unifies customer data, segments buyers by behavior and value, predicts churn, and ranks the next-best action, so a coverage gap can be checked against the customers it actually affects. A missing messaging territory matters far more when your best segment is the one that cares about it.
How do you build a competitive ad benchmark?
Five steps, in order.
- Name the set. A specific list of competitors somebody could disagree with. "The market" is not a baseline, and a set chosen after the fact will flatter whatever you hoped to find.
- Pull live creative evenly. Enough from each advertiser that no single one dominates the baseline, and taken in one window so seasonality does not creep in on one side.
- Classify with one taxonomy. Angle, concept, hook, format and messaging dimension, defined once and applied identically to every ad including yours. Classify blind to the brand where you can.
- Score against the baseline, one store at a time. Your library against the category, never one brand against another.
- Record the sample with the result. Ad counts per advertiser, the window, and the competitor list, attached to the finding rather than filed separately.
The blind classification step is the one most often skipped and the one that matters most. Knowing which brand an ad belongs to shifts the classification toward the story you already believe, reliably and without anybody noticing they are doing it.
How do you report ad benchmarks honestly?
Three habits keep this work trustworthy over time.
State what the number is not. "Led on 3 of 9 messaging dimensions" is a coverage reading. It is not a claim about revenue, market share or advertising effectiveness, and writing that sentence next to the finding costs one line and prevents a year of misquotation.
Date everything. A category baseline is a snapshot, and it decays. A coverage lead measured in one quarter can be gone by the next without anything in your own library changing, which is a fact about the field rather than about you.
And separate the structural from the financial in the report itself. Coverage, longevity, mix and concentration belong together and belong apart from anything about profit or margin. Blending the two produces a document that reads as though the ad library told you what your competitors earn, which it did not, and cannot.
FAQ: benchmarking ads without spend data
Can you benchmark a competitor without spend data?
Yes, structurally. Public ad libraries publish live creative and first-seen dates, so hooks, concepts, angles, formats, messaging coverage and days active are all classifiable without access to spend, ROAS or conversions. What you get is a description of what a competitor argues and how durably, which is a smaller claim than performance and a far more available one.
What can you actually see in a public ad library?
The live creative itself, when each ad was first seen, and therefore how long it has been running. From the creative you can classify the angle, the concept, the hook, the format and which messaging territory it occupies. What you cannot see is spend, impressions, conversions, return or margin, and no amount of analysis recovers those from the library.
What are messaging dimensions?
Messaging dimensions are the distinct claim territories a category argues in, such as proof, risk reversal, ease, price justification or provenance. Coverage across them is scored because a brand can be strong in one territory and entirely absent from another, and absence is usually a decision nobody made rather than a decision somebody made.
What does leading on 3 of 9 messaging dimensions mean?
It means that on three of the nine dimensions scored, the brand's coverage was stronger than the category baseline, and on the other six it matched or trailed. In the audit where that result appeared it was recorded as directional, because the sample of live creative was thin enough that a small change in the set could move the count.
Why does the audit score one store at a time?
Because the comparison that holds is a single advertiser against a category baseline, not two advertisers set against each other. Scoring one store at a time keeps the baseline stable and the finding interpretable, and it avoids implying a head to head result that the underlying data cannot support.
How thin is too thin a sample?
There is no fixed floor, and the honest test is sensitivity. If adding or removing two or three ads would change the conclusion, the sample is thin and the finding is directional. Say so in the report rather than in a footnote, because a number presented without its sample will be quoted later without it too.
Does a competitor's long-running ad prove it is profitable?
No. It proves the competitor keeps choosing to pay for it, which is evidence of competitiveness rather than of profit. Longevity is a structural signal and profit is a financial one, and a public library carries the first and never the second. Treating durability as proof of margin is the most common overreach in competitive analysis.
How often should competitive benchmarking be re-run?
Quarterly suits most categories, because angle and messaging coverage move slowly while hooks move fast. Re-run sooner when a large competitor repositions or a funded new entrant appears, since either can shift the category baseline within weeks and turn a lead you hold into the new minimum.
The bottom line
The numbers you want from a competitor are the ones you will never get, and the ones you can have are better than teams expect. What a rival argues, how they dramatize it, how they open, what they can produce, and which of those arguments has survived long enough that they keep funding it: all public, all classifiable, none of it requiring anybody's permission. Score one store at a time against a named category, apply one taxonomy to both sides, and write the sample next to the finding. Then stop where the evidence stops. A structural benchmark that says "led on 3 of 9 dimensions, directional, thin sample" is worth more than a confident chart implying you are beating somebody, because the first can be acted on and defended, and the second falls apart the first time anyone asks how it was built.